Documentation

Dashboard
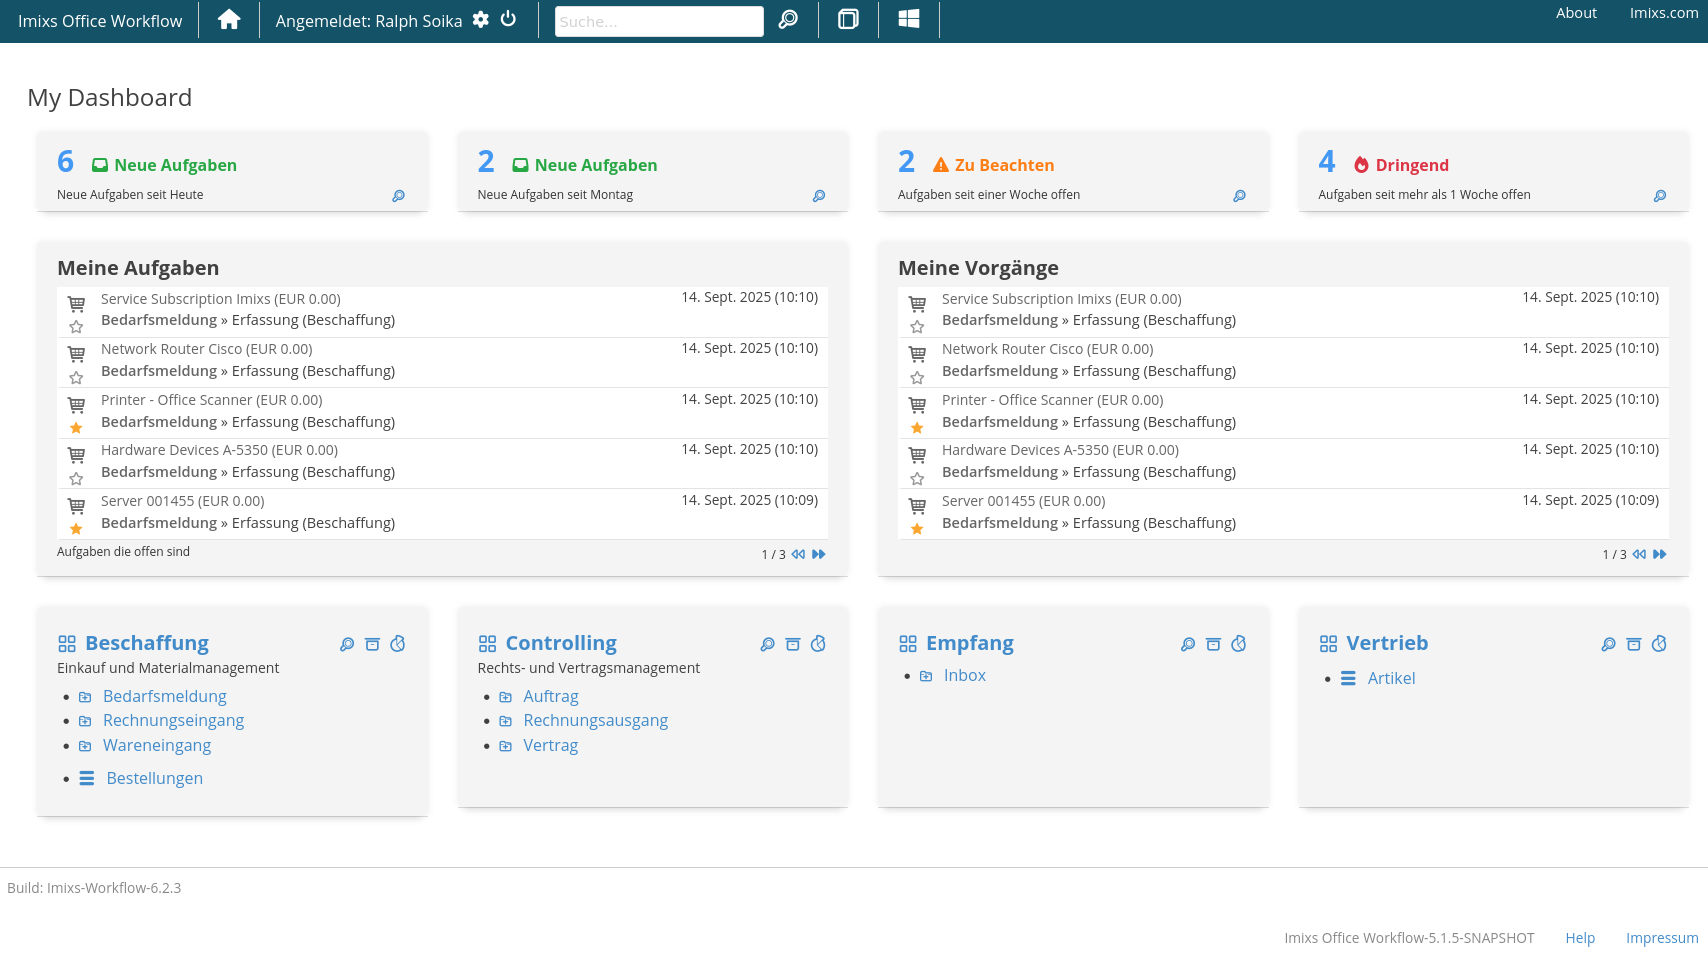
The Dashboard feature gives you a great opportunity to display open task, stats and important information to users or user groups. Dashboards can be configured individual simmilar like custom forms.
Setup & Layout
To define a new dashboard you simply add a dashboard definition into the layout section of the general configuraiton:
<imixs-form>
  <imixs-form-section columns="4" label="">
     <item name="dashboard.worklist.count.today" type="custom" path="cards/plain"  label=""
           options='{"class":"flat success", "icon":"fa-inbox", "label":"Neue Aufgaben", "description":"Neue Aufgaben seit Heute"}'   />
     <item name="dashboard.worklist.count.oneweek" type="custom" path="cards/plain"  label=""
           options='{"class":"flat warning", "icon":"fa-exclamation-triangle", "label":"Zu Beachten", "description":"Aufgaben seit einer Woche offen"}'    />
     <item name="dashboard.worklist.count.urgent" type="custom" path="cards/plain"  label=""
           options='{"class":"flat error", "icon":"fa-fire", "label":"Dringend", "description":"Aufgaben seit mehr als 1 Woche offen"}'    />
     <item name="dashboard.worklist.count.all" type="custom" path="cards/plain" label=""
           options='{"class":"flat", "icon":"fa-tasks", "label":"Alle Aufgaben", "description":"Meine offenen Aufgaben"}' />
   </imixs-form-section>
   <imixs-form-section columns="2">
     <item name="dashboard.worklist.owner" type="custom" path="cards/worklist"
         options='{ "label":"Meine Aufgaben", "description":"Aufgaben die offen sind"}'/>
     <item name="dashboard.worklist.creator" type="custom" path="cards/worklist"
         options='{ "label":"Meine Vorgänge", "description":""}'/>
   </imixs-form-section>
   <imixs-form-section columns="3" label="">
      <item name="worklist.stats.count.beschaffung" type="custom" path="cards/plain"
            options='{"class":"lead", "key":"process", "value":"Beschaffung"}'   />
      <item name="worklist.stats.chart.beschaffung" type="custom" path="cards/chart"
            options='{"key":"process", "value":"Beschaffung"}'   />
      <item name="worklist.stats.chart.rechnungseingang" type="custom" path="cards/chart"
            options='{"key":"$workflowgroup", "value":"Rechnungseingang"}'   />
   </imixs-form-section>
</imixs-form>
See the layout section for more information about how to arrange elements.
Cards
Da dashboard consists on form card elements located under /cards
Each card can display information provided by the DashboardAnalyticController component. The following table shows an overview about predefined card content:
| Analytic ID | Type | Card | Description | |
|---|---|---|---|---|
| Counter | ||||
| dashboard.worklist.owner.count.today | counter | plain | Counts all new tasks for the current user for this day | |
| dashboard.worklist.owner.count.thisweek | counter | plain | Counts all tasks for the current user since the current week (stared on Monday) | |
| dashboard.worklist.owner.count.oneweek | counter | plain | Counts all tasks for the current user since the last 7 days | |
| dashboard.worklist.owner.count.urgent | counter | plain | Counts all tasks for the current user older then 7 days | |
| dashboard.worklist.owner.count.all | counter | plain | Counts all tasks for the current user | |
| Views | ||||
| dashboard.worklist.owner | view | worklist | Shows a view with all tasks for the current user | |
| dashboard.worklist.creator | view | worklist | Shows a view with all tasks created by the current user | |
| dashboard.worklist.participant | view | worklist | Shows a view with all tasks the current user is a participant | |
| dashboard.worklist.favorite | view | worklist | Shows a view with all favorites tasks marked by the current user | |
| Statistic | ||||
| worklist.stats.count.[NAME] | counter | plain | Shows the count of process instances for a given process or workflow group process | |
| worklist.stats.chart.[NAME] | counter | chart | Shows a chart diagram of process instances for a given process or workflow group process over the last 6 months | |
| Information | ||||
| [PROCESS NAME] | counter | startprocess | Shows information about a process |
Workflow Stats
The ProcessAnalyticController provides different stats for process instances. The following shows a example section that displayes 2 Diagrams
    <imixs-form-section columns="3" label="">
        <item name="worklist.stats.count.sales" type="custom" path="cards/plain"
            options='{"class":"lead", "key":"process", "value":"Sales"}' />
        <item name="worklist.stats.chart.Sales" type="custom" path="cards/chart"
            options='{"key":"$workflowgroup", "value":"Outbound Invoice"}' />

    </imixs-form-section>
The first item shows a counter with all process instances in the process group ‘Sales’, the second one shows a chart diagram with all process instances of the workflow grup ‘Outbound Invoice’ created during the last 6 months.